silverado goldmines (867737)
Optionen
| Boardmail an "SWay" |
Wertpapier: Silverado Gold Mines |
Und weil das nicht möglich ist ,und neue KKW geplant sind um die stetig steigende Energieversorgung abzusichern ,wird wohl kein Weg an Silverado vorbeigehen oder mindestens ihren Weg kreuzen.Wir wissen es alle nur wann reagieren die Politiker endlich positiv auf weitere Unterstützungen ,auch bei der CO2-Abtrennung?
Zum Kurs :Die Frage lautet, Wie viele geben ihre Anteile unter 0.100 noch her ?
__________________________________________________
SPD-Umweltexperte: Bedenken wegen CO2-Ausstoß bei Dong-Kraftwerk
dpa-Meldung, 15.05.2007 (16:48)
Lubmin - Der umweltpolitische Sprecher der SPD- Landtagsfraktion, Gottfried Timm, hat Bedenken wegen des Kohlendioxidausstoßes des geplanten Steinkohlekraftwerks in Lubmin geäußert. Die Emission durch das Kraftwerk des dänischen Energiekonzerns Dong Energy sei ein großes umweltpolitisches Problem, sagte Timm nach einem Treffen mit Vertretern von Dong Energy und der Energiewerke Nord (EWN) am Dienstag in Lubmin. Timm hatte gemeinsam mit dem sicherheitspolitischen Sprecher der SPD, Norbert Nieszery, den früheren Atomstandort besucht.
http://www.verivox.de/News/ArticleDetails.asp?aid=19271
Die 0,07€ halten doch! Der Fahrstuhl wird nur noch repariert und dann geht es wieder in die höheren Stockwerke...
Optionen
| Boardmail an "tornadotoni" |
Wertpapier: Silverado Gold Mines |
dann gehts wieder aufwärts, denn er will sie ja wieder mit 100%
Gewinn verkaufen.
Ich geh lieber wieder unterm Freisitz und horche den zwitschernden Vögelchen im Garten zu.
Wenn sie Green Fuel zwitschern komm ich wieder!
guten Abend
LB
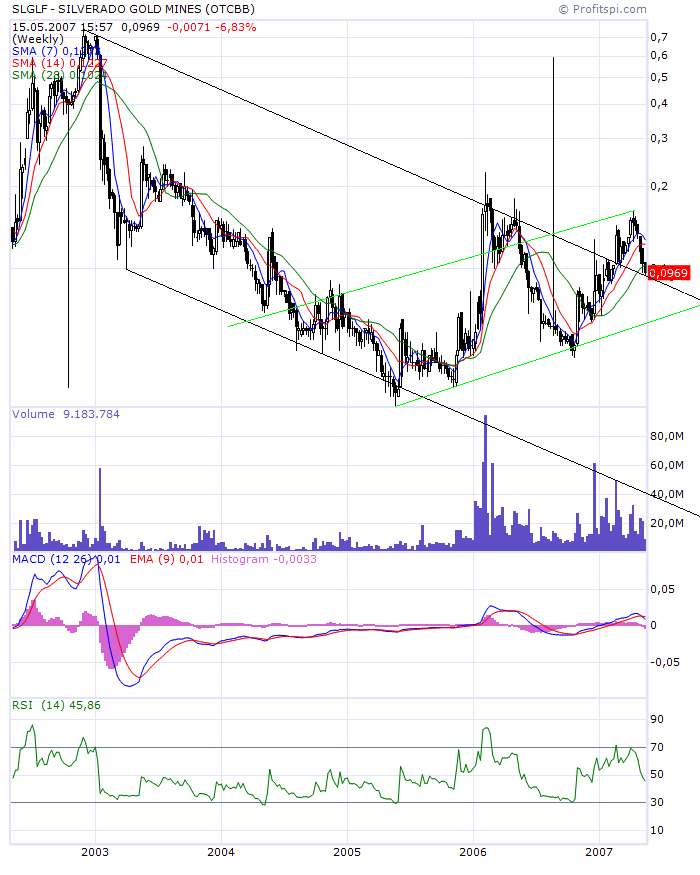
RSI hat die 50 gebrochen!
MACD ist nach unten abgeprallt!
200er SMA gebrochen!
James Dixon verkauft 500000 Shares zu 0,1$ (warum so billig ?, andererseits nicht gerade die Masse an Shares !) !
Sieht ja alles soooo negativ aus *ggg ;-)
Aber so richtig in den Abwärtstrendkanal will sie auch nicht wieder rein laufen, bis jetzt !?
Mal schauen, die weekly Kerze ist noch nicht abgeschlossen !
greets sts
Angehängte Grafik:
1.png (verkleinert auf 72%)
1.png (verkleinert auf 72%)
Wenn beides nicht voran schreitet, naja ihr seht ja selbst wo uns der Abwärtstrendkanal hinführt.
Aber ihr seht auch wo uns der Aufwärtstrendkanal hinführt und der könnte auch irgendwann mal nach oben ausbrechen der Abwärtstrend kann wenigstens nicht nach unten brechen *ggg
Also immernoch Chanche/Risiko ++++++/++++++
Nicht vergessen !!
Also nicht die gleich die ganze Kohle reinzustecken ist auf jeden Fall ratsam.
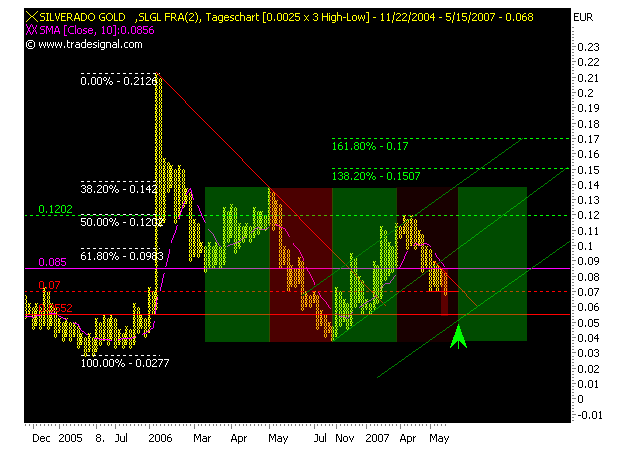
Silverado ist bei Trading-pennies heute einmal auf der Kaufliste.
Warum,weshalb,evtl. weil mal wieder eine kleine Reaktion nach oben
zu erwarten ist.
Geduld ist angesagt. Momentan ist eh alles im A..rgen.
Optionen
| Boardmail an "SWay" |
Wertpapier: Silverado Gold Mines |
Angehängte Grafik:
Pennys.JPG (verkleinert auf 50%)

Pennys.JPG (verkleinert auf 50%)
Optionen
| Boardmail an "kleinlieschen" |
Wertpapier: Silverado Gold Mines |
Update
(I was on the road again Wednesday, so missed the action in SLGLF. Had to drive clear across state to pick up a horse. Glad that trip is over.)
When I left Tuesday, I placed a limit order at .09 – that price target didn’t happen yesterday, perhaps today.
After Wednesday’s price decline, we are now reaching a critical juncture. If this current correction is a normal bull market correction, the price needs to be contained around about the .618 fibonacci retracement level of .09. If the price falls below this support level, it would be bearish, resulting in even lower prices, I believe.
Ok, for those of you who can appreciate technical analysis, here is what I’m seeing this morning after yesterday’s price action.
On the daily chart, we came very close to the .09 target by reaching a low of .092; however the close was at .096 – although the price range did stay below the 10 day intraday downtrend line. The price low is getting very close to the long term 200 day moving average – a crossover of this MA would be bearish – so I will be watching today to see if the intra-day prices cross below this MA – although right now I am not expecting that to happen today. The 200 day MA is a long term trend indicator. Looking at both the daily and weekly charts, the price is resting just above the 200 daily & weekly MA’s. This MA should give pretty good support, however the upward trendline from the November 2006 low, was breached yesterday – ever so slightly – now this could just be an overshoot of the trendline and not be a bear sign, as overshoots do happen when there is extreme sentiment in either direction.
Although, there are other indicators that are not very positive, so I am still seeing weakness in the chart. Volume has been in a downtrend since December and, as yet, volume has not broken above the downtrend. I would want to see a volume break out above the downtrend line coupled with a nice uptick in price. That would be a bullish sign.
Ok, here is what some of the other tech indicators are suggesting. On the daily chart: MACD still not a bullish crossover but is reaching extreme oversold area. RSI still negative. William %R broke above its downtrend line and then came back and retested it and held – slightly positive sign. Slow STOCH has turned up and broken above downward trendline – slightly positive sign.
On the Weekly chart: I am seeing more bearishness on the Weekly chart than on the daily chart – this concerns me. As mentioned in my prior post, the weekly MACD has crossover in overbought territory – this will be putting a damper on higher prices. Also, the RSI and slow STOCH have both broken below the neutral zone and are bearish. STOCH has also broken below its upward trendline and is heading for extreme overbought territory but is not there yet – another bearish sign. And, as mentioned above, price is sitting just above the long term 200 MA. The Weekly chart is putting a lot of downward pressure on the price, so I’m not seeing much strength that could push prices up substantially at this juncture. Additionally, the HUI (Amex Gold Bug Index) has been in an ascending triangle since fall of last year, and it is looking like it might breakdown through the uptrend support line of the triangle – this would be bearish if it does actually breakdown through support – it is currently testing this support. Normally, ascending triangles are bullish formations, but if the triangle fails and is broken to the downside this would be a bearish sign. So, watching what happens in the HUI might be a good thing. Further, a break below the long term upward trendline from the May 2006 low – would be really bearish if that happens. On the other hand, the XAU looks like it has formed a symmetrical triangle, which is a continuation pattern – normally, a continuation pattern implies that price will continue the trend. However, the norm is for a breakout of the triangle in the prevail trend direction – this does not always happen, and a break in the opposite direction can happen – in this case it would be bearish.
I know Expertuis is expecting the PM low here to hold and higher prices to resume (see post #1863) – I respect Expertuis’s input, but I am not as optimistic at this current time (I really hope he is right). A few more days of action in the PM market will tell the story, I think.
Bottomline: I believe the daily chart is showing that the downward action in price is running out of steam. However, the price must hold and rebound soon, because a break below .09 would suggest even lower prices and perhaps a bear market, instead of a bull market correction. The action for the next couple of days should give us a clue which way the price will go. My current thought is that we will see a SLGLF rebound in daily price action soon, but that it may just be a technical rebound and then we will see prices go lower – as the Weekly chart is suggesting could happen. Some bullish news out of SLGLF headquarters would probably be a good thing right now, and if it doesn’t come soon, then I doubt we will see much upward momentum.
Caveat: I don’t try to predict the future, I only express what the charts are suggesting the future may hold. Sometimes the Magic Genie has a trick or two up her sleeve that cannot be anticipated. Like the saying goes, “A fool and his money are soon parted.” Just don’t be a fool and play the penny stock market with the family’s grocery money.
nächstes downziel die 0,05€! ob die halten bleibt dann abzuwarten!
was uns allerdings bei solchen Kursen erspart bleibt?
Eine erneute Aktienvermehrung...
ps.vielleicht haut es mit dem zyklus hin... keine ahnung, nun ist auch ziemlich meine phantasie am ende!
Viel Spaß Garry mit meinem Geld...
Optionen
| Boardmail an "tornadotoni" |
Wertpapier: Silverado Gold Mines |
Angehängte Grafik:
chart_p&f.png (verkleinert auf 81%)
chart_p&f.png (verkleinert auf 81%)
Optionen
| Boardmail an "tornadotoni" |
Wertpapier: Silverado Gold Mines |
Angehängte Grafik:
chart.png (verkleinert auf 81%)
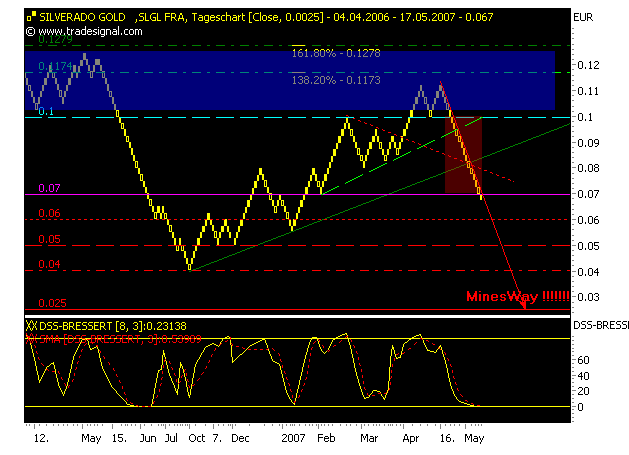
chart.png (verkleinert auf 81%)
Glück auf.
Optionen
| Boardmail an "SWay" |
Wertpapier: Silverado Gold Mines |
das is Fakt!
In die hat man mit absprache von Charttechnikern gemacht! da man die chance sah das der weg nach oben offen ist und man die menge locker kompensieren konnte... aber da irrte man sich gewaltig!
Optionen
| Boardmail an "tornadotoni" |
Wertpapier: Silverado Gold Mines |
Optionen
| Boardmail an "SWay" |
Wertpapier: Silverado Gold Mines |
Optionen
| Boardmail an "tornadotoni" |
Wertpapier: Silverado Gold Mines |
Optionen
| Boardmail an "SWay" |
Wertpapier: Silverado Gold Mines |
Optionen
| Boardmail an "SWay" |
Wertpapier: Silverado Gold Mines |
hörma hab nix geklaut! will doch auch mal richtig einen raus hauen... so richtig prolloooo
so dann mal noch ne schöne nacht!
Optionen
| Boardmail an "tornadotoni" |
Wertpapier: Silverado Gold Mines |
By CRAIG THOMAS
U.S. Senator
If you have filled up your car with gas recently, you have probably noticed that your wallet might be lighter than usual. In just the last two weeks, the average price for gasoline rose to an all-time high, breaking $3 for a gallon of gas. In fact, some experts are predicting that gas prices could possibly reach $4 a gallon in the near future. These rising gas prices are placing an undue burden squarely on the backs of every American.
http://www.futurecoalfuels.org/news.asp
ps . TT ,sei froh ,mit einer grossen Stückzahl kannst du ja beruhigt abwarten .Hoch wird es jedenfalls wieder gehen,wenn auch nicht sofort.Und die heheh-Generation weiss genau so wenig bescheid wie wir ob der Kurs rauf oder runter gehen wird.Sei es jetzt oder vor wenigen Wochen . VG
obwohl notierte ja neutral da gestern 0,0697€! und dadurch kein aktives shortsignal...
schönen tag noch...
ps.melu nett von Dir, es stimuliert mich positiv!
Optionen
| Boardmail an "tornadotoni" |
Wertpapier: Silverado Gold Mines |