f-h OP BW & Friends-TTT, Freitach 22.08.2003
Seite 24 von 27 Neuester Beitrag: 25.04.21 13:13 | ||||
| Eröffnet am: | 22.08.03 00:11 | von: first-henri | Anzahl Beiträge: | 655 |
| Neuester Beitrag: | 25.04.21 13:13 | von: Ulrikenhtxa | Leser gesamt: | 55.602 |
| Forum: | Börse | Leser heute: | 27 | |
| Bewertet mit: | ||||
| Seite: < 1 | ... | 21 | 22 | 23 | | 25 | 26 | 27 > | ||||
Ich werde es montag früh spontan entscheiden.
greetz
Barron's Online - Getting Technical
WEDNESDAY, AUGUST 20, 2003 5:01 p.m. EDT
GETTING TECHNICAL |
By MICHAEL KAHN
The Market Breaks Out on Vapors
The Markets' Mood
THE ACTION IN THE stock market over the past two months has been nothing
short of disheartening, especially for those looking for patterns,
breakouts and trends. Breakouts and breakdowns have failed each and every
time, and now the sideways action is on the verge of outliving what we
might call a normal corrective pause.
It surely shakes the foundations of technical analysis, at least the kind
of analysis that many of us now assume will work every time.
The doldrums of August, when both traders and trading volume go on
holiday, often gives critics some ammunition to proclaim that technical
analysis does not work.
Of course, nothing could be further from the truth. Low turnover is
clearly a bane for analysts, but when we look at the bigger picture,
things are still following the "plan." The current short-term condition
does not violate what we think the market has been telling us for months
-- that there is still a little life left in the bull.
That brings us back to today. I am reminded of Bishop Berkeley's famous
philosophical question, "If a tree falls in the forest and no one hears
it, does it make a sound?" How about, "If the market breaks out and nobody
is there to trade, does it make a profit?"
Technical analysis measures mass psychology and the behavior of crowds --
and for that, obviously, we need the masses and the crowds, i.e., turnover
and liquidity. It makes short-term analysis in late August a dicey
proposition, because when volume is light, traditional signals either
don't work or work in a way that we do not expect.
That's the excuse we can use for getting whipsawed by this market. It's
also why traders take time off in August.
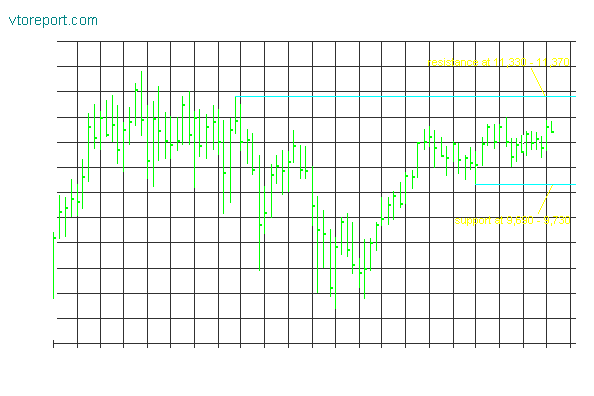
So, does the current breakout mean anything? If we look at the New York
Stock Exchange Composite index, we can see that the market broke out last
week (see Chart 1). Its form is almost a perfect flag pattern that is
proportional in both price and time, the latter being a measure of the
number of days spent rising versus the number of days spent correcting.
CHART 1
For those who follow Fibonacci numbers, the rally was 66 days long and the
flag was 40 days long. The ratio of 40 divided by 66 is approximately
equal to the Fibonacci retracement of 61.8%. This is one of the key ratios
we see throughout the markets, as well as in the way natural phenomena
unfold (such as the spiraling of a galaxy or the petals on a flower).
But without volume, can we believe what we see? Well, certainly it would
be better to have that volume on our side, but price rules. For what it's
worth, studies that keep a running tab on volume on up days minus volume
on down days are rising to indicate that what little volume there is comes
in mostly when prices are going up. This is positive.
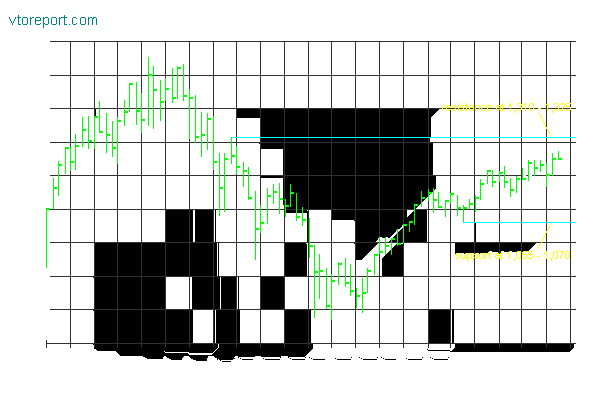
The Nasdaq Composite index is another story. This week, we saw some big
price movement in the index, and that range expansion (the distance the
index travels in a single day) is also a sign of a healthy market (see
Chart 2). While volume here also has been light, at least it was able to
tick above its 50-day moving average during one of those big price move
days.
CHART 2
Did the Nasdaq make a noise when it broke out? Yes, even if few heard it.
And even though Hewlett-Packard's poor earnings release was a drag on the
market Wednesday morning, the Nasdaq's price hasn't collapsed.
Considering that a double resistance is right overhead in the form of the
old high and a test of the former rising trend line from March, investors
didn't use the Hewlett-Packard news as an excuse to sell. This is another
positive.
While we wait for the presumed pickup in trading volume when traders
return after Labor Day, it is a good time to look at some of the
undercurrents in the market today. One topic we've talked about here in
the past has been the rotation of market sectors as they lead the business
cycle.
David Steckler of LPL Financial Services, an analyst and portfolio manager
who follows this cycle closely, points out that the stock market is likely
in a phase where basic materials and technology outperform and financial
stocks start to lag.
We've already seen technology do well, and over the past few weeks basic
materials stocks like chemicals and metals, both precious and industrial,
have really picked up the pace (see Chart 3).
CHART 3
This is the old news. The new news is the recent backup of interest rates
and the underperformance of bank stocks since the July high (see Chart 4).
CHART 4
What does it mean for our portfolios? It does suggest areas on which to
focus and areas to avoid. It does not mean that the market as a whole is
going to do or not do too much. Take it as a portfolio-weighting exercise
rather than a market forecast.
The market is always making some sound, whether we are there to hear it or
not. Our job is to listen closely to see if there are some useful bits of
information buried in that noise, such as subtle sector shifts, and then
be prepared to act when liquidity and more reliable basic analysis return.
Michael Kahn writes the daily "Quick Takes Pro" and the weekly "Quick
Takes Lite" technical newsletters (http://www.midnighttrader.com). He is
the author of two books on technical analysis, most recently Technical
Analysis: Plain and Simple, and was Chief Technical Analyst for
BridgeNews. He also is Director of Marketing for the Market Technicians
Association (www.mta.org).
Wünsche allen hier ein schönes WE, erholt euch ordentlich und wir sehen uns montag pünktlich um 8.00 (ich versuchs).
Machts gut euer r4lle
greetz
Falls nichts ausßergewöhnliches passiert, kommst Du nie in die Gewinnzone! Also; Warten.
J
backwash wäre stolz auf dich.
@Jo ist nicht unbedingt gesagt, aber am Montag muß ich dir wohl Recht geben.
Da ist zuerst Seitenlinie angesagt.
hardyman
August 21, 2003 |
 |
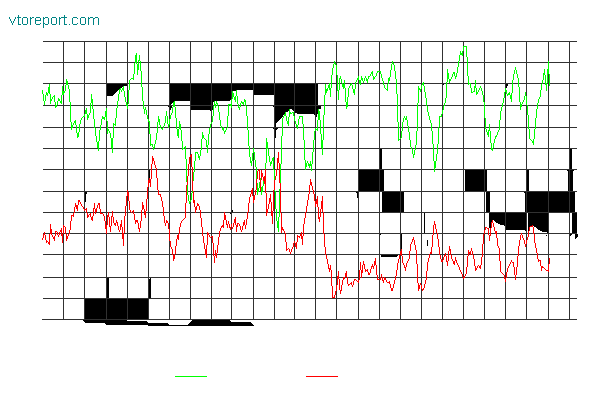
| Market Sentiment |
| Bullish Advisors: 55.1% Bearish Advisors: 18.4% |
 |
Source: Investors Intelligence |
 |
| Market Sentiment vs. S&P 500 |
| Bullish Advisors Minus Bearish Advisors: 36.7% |
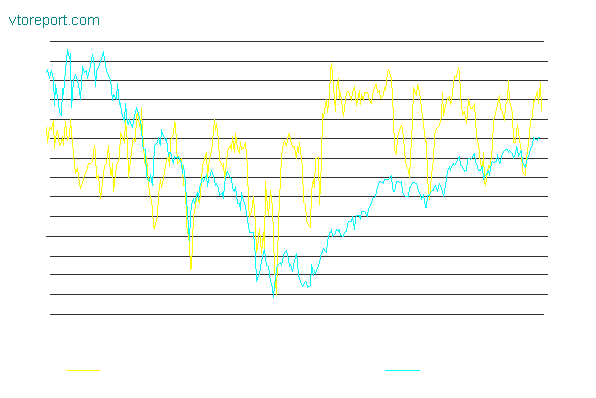 |
| The market usually suffers a short-term dip when the spread between bullish and bearish advisors rises above 29%. |
|
August 21, 2003 |
 |
| Market Sentiment |
| Bullish Advisors: 55.1% Bearish Advisors: 18.4% |
 |
Source: Investors Intelligence |
 |
| Market Sentiment vs. S&P 500 |
| Bullish Advisors Minus Bearish Advisors: 36.7% |
 |
| The market usually suffers a short-term dip when the spread between bullish and bearish advisors rises above 29%. |
|
| VIX/VXN Relative VIX/VXN |
 |
August 22, 2003 |
 |
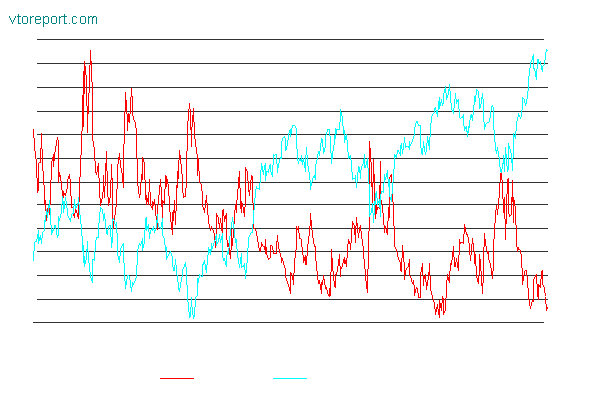
| Market Volatility Index (VIX) vs. S&P 500 |
| Today's VIX: 20.38 Previous VIX: 19.53 |
 |
 |
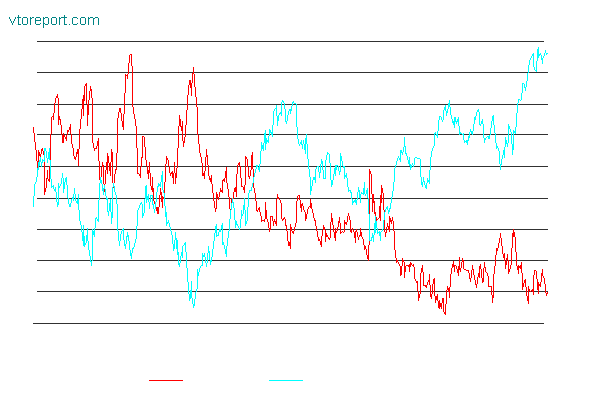
| Nasdaq Volatility Index (VXN) vs. Nasdaq 100 |
| Today's VXN: 29.44 Previous VXN: 28.28 |
 |
|
August 19, 2003 |
 |
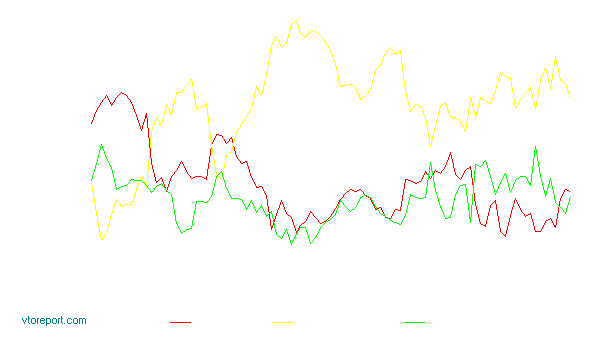
| COT - Dow Jones Industrial Average |
Weekly Chart |
| Long | Short | Net | |||||||
| Large | 10,452 | 20,422 | -9,970 | ||||||
| Commercial | 26,188 | 9,719 | 16,469 | ||||||
| Small | 6,742 | 13,241 | -6,499 |
 |
 |
 |
COT - S&P 500 |
Weekly Chart |
| Long | Short | Net | |||||||
| Large | 41,006 | 65,260 | -24,254 | ||||||
| Commercial | 404,665 | 455,381 | -50,716 | ||||||
| Small | 162,034 | 87,064 | 74,970 |
 |
|
 |
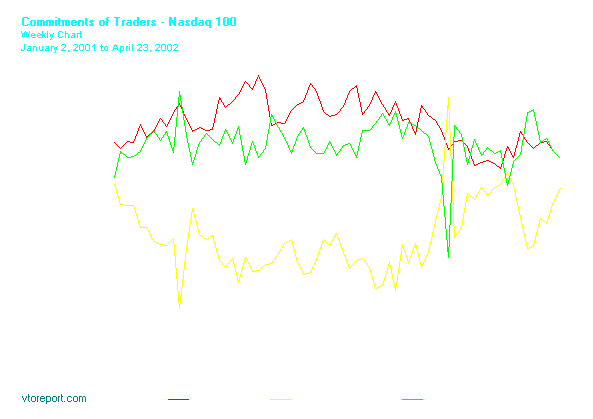
COT - Nasdaq 100 |
Weekly Chart |
| Long | Short | Net | |||||||
| Large | 26,171 | 20,477 | 5,694 | ||||||
| Commercial | 32,107 | 53,274 | -21,167 | ||||||
| Small | 25,607 | 10,134 | 15,473 |
 |
 |
 |
|
August 22, 2003 |
 |
| Dow Jones Industrial Average | |
Today's High: 9,499.97 Low: 9,345.86 Close: 9,348.87 Change: -74.81 | MTD: +1.2% YTD: +12.1% |
5-Day RSI: 50.5 - Neutral | |
5-Week RSI: 73.7 - Overbought | |
|
 |
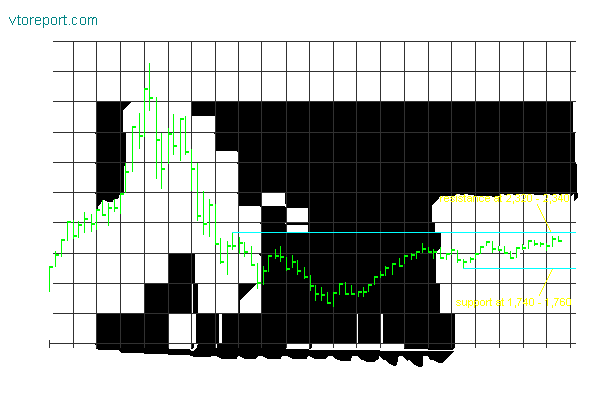
S&P 500 | |
Today's High: 1,011.01 Low: 992.62 Close: 993.06 Change: -10.21 | MTD: +0.3% YTD: +12.9% |
5-Day RSI: 46.8 - Neutral | PE Ratio: 28.6 |
5-Week RSI: 62.1 - Neutral | Nikkei 225 vs. S&P 500 |
|
 |
Nasdaq Composite | |
Today's High: 1,812.49 Low: 1,765.30 Close: 1,765.32 Change: -12.23 | MTD: +1.7% YTD: +32.2% |
5-Day RSI: 73.4 - Neutral | |
5-Week RSI: 70.4 - Neutral | |
 |
 |
| Overbought/Oversold RSI Levels |
Greetz f-h
Wollte dir nochmal für deine unterstützung danken.
wünsch dir ein schönes und erholsames WE.
greetz
Dabei hab' ich doch die Sternennadel von Consors *g*...Unterstützung...klar, sehr gerne, jeder im thread trägt seinen Teil bei, streng nach der Devise "Information ist alles", obwohl das streng nicht sooo ganz zutrifft bei unserem etwas lockererem Umgangson...das ist aber gut so. Hatte mir gestern mein Szenario gemalt und wollte wahrscheinlich einfach nicht wahrhaben, daß die Märkte an "jedem" bekannten Chartmarken einfach drehen, Lolo hat mit seinem Beitrag "manchmal kann es so leicht sein" absolut Recht gehabt...Montag ist mein Kopf wieder auf neutral, vielleicht hau' ich dann mal einen raus, wobei eine gewisse Portion Skepsis immer dazugehört...eines macht mich jedoch stolz, ich kann sagen "Ich war dabei" *gggggggg* auch wenn's mal die falsche Seite war *lol*
Greetz und auch Dir ein angenehmes WE f-h
Aber viel hab ich von dir gelernt und ich schätze dich sehr als mensch denn du warst nicht abgeneigt mit mir zu telefonieren um mir einige tips zugeben obwohl du mich kein stück kanntest. Also nochmal riesen lob an dich (aber nu reichts *gg*)!
Bin gespannt wie die folgenden wochen aussehen. Jeder Tag gibt neue chancen und das ist das schöne an der börse.
greetz
(©GodmodeTrader - http://www.godmode-trader.de)
Mit dem neuen Segment präsentiert Sal. Oppenheim eine weitere Generation von modernen Hebelprodukten. Sie erhalten sofort 10,00 Euro ausgezahlt, sobald das jeweilige TAKE 10-Level erreicht wurde.
Aktuell bieten wir Ihnen zehn TAKE 10-Scheine auf den DAX® mit einer Laufzeit bis 28. November 2003 an, die Sie sofort handeln können!
http://www.oppenheim-derivate.de/de/oppenheim/...e/pdfs/TS_125939.PDF
http://www.oppenheim-derivate.de/derivate/index/0,2307,285,00.html
*Die Verkaufskurse werden fortlaufend angepasst. Maximale Gewinne von 41% bis 350% locken.*
Die Verkaufskurse werden fortlaufend angepasst! Der maximale Gewinn errechnet sich aus der Differenz zwischen der Rückzahlung von 10,00 Euro bei Erreichen des TAKE 10-Levels und dem Verkaufskurs.
Für Daytrader belieben aber die KO-Scheine immer noch erste Wahl.

